This is Naked Capitalism fundraising week. 1012 donors have already invested in our efforts to combat corruption and predatory conduct, particularly in the financial realm. Please join us and participate via our donation page, which shows how to give via check, credit card, debit card, or PayPal. Read about why we’re doing this fundraiser, what we’ve accomplished in the last year, and our current goal, thanking our guest writers
By Jeffrey Clemens, Associate Professor in the Department of Economics, University of California at San Diego and Stan Veuger, Resident Scholar, American Enterprise Institute. Originally published at VoxEU.
The COVID-19 shock has significant negative consequences for the finances of US state and local governments, especially since they are bound by balanced-budget requirements. Estimates of (expected) revenue shortfalls are therefore an important input in the allocation of federal funds to offset the pandemic’s effects on state and local government revenues. This column uses Congressional Budget Office projections of consumption and personal income to forecast sales and income tax bases and revenue for all of the states. Based on May and July projections, it estimates a total shortfall of $106 billion and $105 billion, respectively.
The COVID-19 pandemic has placed tremendous strain on the budgets of governments everywhere, both on the revenue and the spending side. In late July, this led EU national leaders to agree on a €750 billion Recovery Fund to support member states with limited fiscal capacity (Beetsma et al. 2020). It has also given rise to calls for significant support by G20 members to emerging economies (e.g. Berglöf et al. 2020).
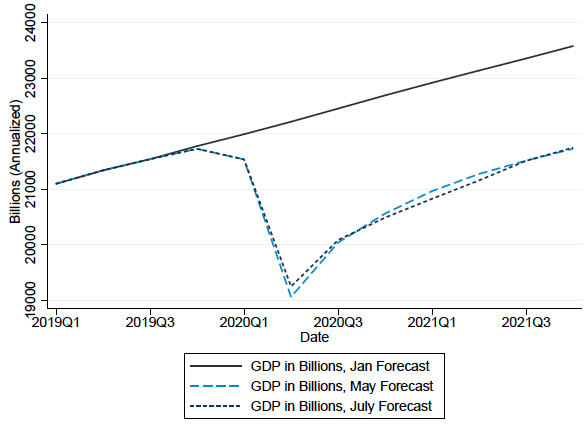
The crux of the budgetary challenge is straightforward: when there is less economic activity, there is less tax revenue. Figure 1 illustrates the extent to which the Congressional Budget Office, the producer of the primary ‘macroeconomic outlook’ forecasts that are relevant to US federal budgeting, believes COVID-19 will reduce the coming year’s economic output. As of July, CBO’s forecast for nominal GDP throughout 2021 was $21.7 trillion. This falls 8% below its pre-pandemic, January forecast of $23.6 trillion.
Figure 1 Updates to CBO’s macroeconomic forecasts: GDP

Source: Congressional Budget Office January, May, and July Economic Outlook (CBO 2020a, 2020).
The Unenviable Position of State and Local Governments
This negative shock has significant consequences for the finances of state and local governments as well as the federal government. In the US, fiscal institutions are such that while the federal government can borrow freely in times of crisis subject only to market discipline, state and local governments are bound by balanced-budget requirements and in most cases have access to only limited rainy-day funds (Clemens and Miran 2012, Driessen 2020, Zhao 2016). Local governments also face legal restrictions on their ability to raise tax revenue (Shoag et al. 2019). This creates a natural role for the federal government in avoiding heavily procyclical fiscal policy at the subnational level.
The federal government transfers substantial resources to state governments for purposes including but not limited to health care for the disadvantaged, education finance, and transportation projects. Some of these funding streams act as fiscal stabilisers without intervention. The Medicaid programme, for example, is America’s main source of funding for the provision of health care services to low-income individuals. In a downturn, more people become eligible for the programme, which triggers additional funds for the states which operate the programme. This reflects the fact that the federal contribution to state Medicaid programmes is structured as a matching grant.
Matching grants inject a measure of fiscal stabilisation to state budgets. They are not, however, structured to offset unexpected revenue shortfalls. While federal policymakers have earmarked additional stabilisation funds to aid in financing pandemic-driven expenditure needs, Congress remains deadlocked over the provision of funds to offset the pandemic’s effects on state and local government revenues (Clemens and Veuger 2020a,b). Estimates of (expected) revenue shortfalls are an important input for this decision-making process.
Estimating state and local government revenue shortfalls
Several recent analyses have taken two contrasting approaches to estimating the revenue shortfalls facing state and local governments. An approach that enjoys some popularity is to estimate the historical relationship between state unemployment rates and revenues, and to base estimates of future revenue on prognosticated unemployment rates (Fiedler et al. 2019). Relying on an April forecast and unemployment data released in May, Bartik (2020) followed this approach to produce an estimated revenue shortfall of $568 billion for state and local governments combined for the fiscal year that runs from 2020Q3 through 2021Q2. McNichol and Leachman (2020) relied on essentially the same approach, but using forecasts from July, to estimate a revenue shortfall of $290 billion for state governments alone for the same period. An extension of McNichol and Leachman’s approach to include local government revenue shortfalls would yield an estimate of $432 billion.
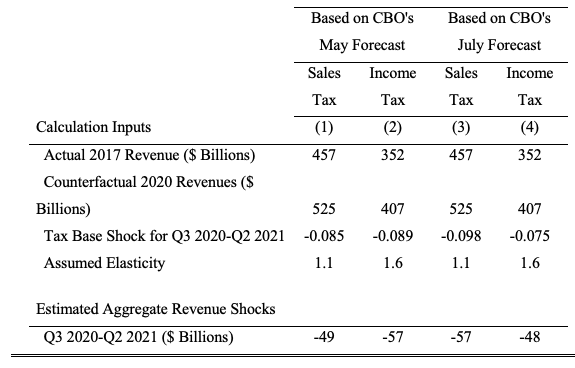
These numbers are significantly greater than those produced by an approach that relies directly on forecasts of macroeconomic aggregates that are more direct proxies for major tax bases. This is the approach we have relied on in our own work (Clemens and Veuger 2020a, 2020b), and it is also the approach implemented by Whitaker (2020a, 2020b). In Clemens and Veuger (2020a), we use May CBO projections of consumption and personal income to forecast sales and income tax bases and revenue for all of the states. We estimate a total shortfall of $106 billion from those specific revenue sources for the 2021 fiscal year. We update these estimates in Clemens and Veuger (2020b), using a July update to CBO’s projections, and arrive at a similar number of $105 billion. These estimates are shown in Table 1.
Table 1 Estimated shocks to state sales and income tax revenues aggregated across all states

Source: Congressional Budget Office January, May, and July Economic Outlook (CBO 2020a, CBO 2020b, CBO 2020c). Annual Survey of State and Local Government Finances (United States Census 2017). Assumed elasticities based on Holcombe and Sobel (1997), Kodryzcki (2014), Anderson and Shimul (2018), Walczak (2019), and Kaeding (2017).
We next make two assumptions to arrive at an estimate of the total revenue shortfall facing state and local governments. First, we assume that other state revenue, such as hospital charges and tuition fees, will evolve as sales tax revenue will. This leads us to estimate a total state government revenue shortfall of $169 billion for the 2021 fiscal year. We then rely on the ratio between state and local government revenue shortfalls in Whitaker’s (2020b) “slow recovery” scenario. Applying this ratio leads us to estimate a grand total revenue shortfall of $236 billion for state and local governments combined. Note that local government revenues are relatively stable thanks to the (relative) stability of property tax revenue (Lutz et al. 2011).
What Explains the Gap Between Our Approach and Estimates Based on Unemployment Rates?
Much of the gap between our estimates and estimates that rely on unemployment rates can be explained by fluctuations in forecasts and the dramatic difference between unemployment forecasts and the path the unemployment rate has recently followed. Specifically, realised unemployment rates and updated unemployment forecasts have been far lower than the forecasts used in the estimates discussed above. If the unemployment rate were to remain at its most recent reading through the second quarter of 2021, Bartik’s (2020) methodology would imply a $325 billion shortfall for the current fiscal year. This is not too far from our estimate. Notably, the $325 billion estimate assumes a constant unemployment rate over the remainder of the current fiscal year, which is likely pessimistic. Further, employment losses have been heavily concentrated among lower-income workers. These factors increase our confidence that the unemployment-based estimate of $325 billion remains at the higher end of plausible outcomes. This assessment is consistent with the independent assessment of Whitaker (2020b), whose pessimistic and intermediate estimates put the shortfall at $350 billion and $171 billion, respectively.
Implications for Policy
The current fiscal year’s revenue shortfalls are a key input to assessing the amount of aid the federal government might beneficially send to state and local governments. They are not the only input, however, and it would be a mistake to equate estimates of revenue shortfalls with optimal federal grants. Other relevant inputs to consider include the aid made available through existing legislation, the full set of crisis-related spending needs, and the duration of the support Congress intends to provide. Regarding the duration of support, it is sobering to consider that CBO’s most recent forecast for 2030 implies that nominal GDP will be 4% below its January forecast for 2030. A portion of the short-run shortfall may thus be better interpreted as a long-run decline in economic output. State and local governments will eventually need to budget accordingly.
In addition, policymakers ought to consider the role state and local rainy-day funds – and resilient budgeting practices more generally – can and should play. They also need to recognise that heterogeneity in budgetary problems across states and localities should make one want to err on the side of providing larger grants across the board to make sure that the hardest-hit places do not have to make overly onerous cuts. The alternative of basing grants on observed or proclaimed distress seems hard to implement without raising significant fairness and moral hazard concerns.
References available at the original.


