The most important figures CalPERS publishes all year are its preliminary returns, which it releases shortly after its June 30 fiscal year end, and its Comprehensive Annual Financial Report, which comes out in November. In recent years, the preliminary returns have been identical to the final result, so this figure, unlike, say, the preliminary GDP estimate, is not typically revised down the road.

It was therefore disconcerting to determine that the figures below, taken from CalPERS July 15 press release, do not add up when you analyze them along with other data provided by CalPERS. Specifically, the 4.7% overall return presented is out of line with the returns reported for the asset classes, which instead point to an overall return of approximately 4.1%.
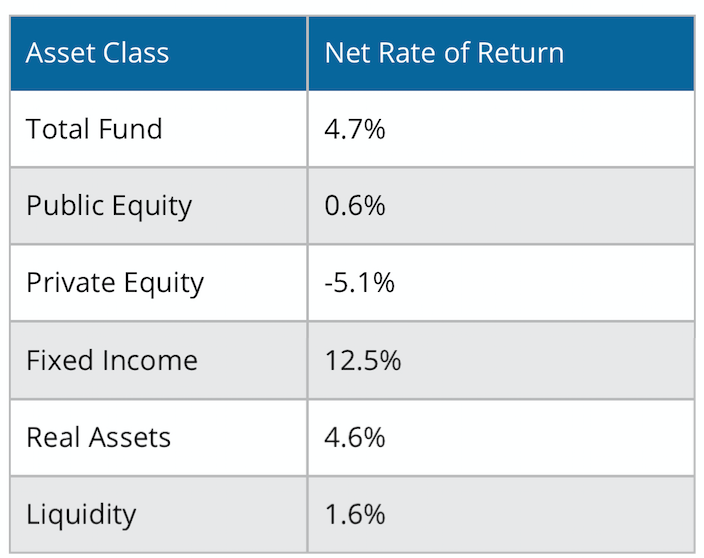
Specifically, if you take the quarterly asset allocations as reported by CalPERS, compute the average for each quarter, and then average those four quarter averages and multiply them by the returns listed for each asset class below, you get 4.12%, not 4.7%, a disparity of 58 basis points.1
A disparity of as much as 0.2%, or 20 basis points, would not be troubling, since it could be the result of timing issues and rounding, In keeping, if you use the same approach with CalPERS’ preliminary returns and its quarterly asset allocations for its previous fiscal year, the disparity is only 5 basis points.
Richard Ennis, a former editor of the Financial Analysts Journal who has spent over 30 years advising pension fund trustees and recently published a major study documenting the poor performance of public pension funds’ investments in “alternative investments” in the authoritative Journal of Portfolio Management, confirmed our concerns:
Based on publicly available information, Naked Capitalism estimates the fiscal year 2020 investment return for CalPERS at 4.12%, which is 58 bps less than the preliminary figure of 4.7% recently released by CalPERS. I reviewed the detailed data underlying the NC figure and, based on that data, 4.12% appears to be a reasonable approximation. 58 bps is far too large a discrepancy to go unresolved. I understand CalPERS has been apprised of the discrepancy. I look forward to seeing a reconciliation of the two figures.
We e-mailed CalPERS two days ago, which is a generous lead time by journalist norms, describing our work and asking for an explanation. Since this report is critically important to CalPERS, one would think it would be easy for them to describe the missing factor or factors that would explain the 58 basis point anomaly. But we have not gotten any response, while CalPERS head of Stakeholder Relations, has already addressed a completely different issue we raised after we e-mailed our questions about the return figures.
Bear in mind that CalPERS’ auditor, BDO, does not audit CalPERS investments. From its Independent Auditor’s Report in CalPERS fiscal year 2019 Comprehensive Annual Financial Report:
The introductory, investment, actuarial, statistical and compliance sections have not been subjected to the auditing procedures applied in the audit of the basic financial statements, and accordingly, we do not express an opinion or provide any assurance on them.
CalPERS publishes its “Investment Section” as a stand-alone document. The only text portion is a cover letter from its Chief Investment Officer; there is no independent certification. Last year’s missive, from Ben Meng, contains this section:
Our Investment Office team, the Board’s pension consultant Wilshire Associates, and State Street Bank & Trust, our master custodian, compiled the investment data presented on the following pages
You can read BDO’s plan for its audit of CalPERS fiscal year 2020 financials here. This slide summarizes key tasks:
00 Independent Auditor’s Annual Plan
A careful reader will note that BDO merely confirms investment “holdings” with custodians and investment managers, and not their valuation methodologies. This should be straightforward with actively traded public investments like stocks and bonds. But as readers know well, CalPERS has substantial positions in illiquid assets, namely real estate and private equity.
Note that CalPERS keeps its own books for its private equity investments, which runs on an in-house system called PEARS, and real estate, where the CalPERS system is named AREIS for Automated Real Estate Information System . Since a significant amount of CalPERS information is reported on a “trust me” basis, it would behoove the system to address any causes for concern promptly.
On top of that, our result, if confirmed, would have significant implications for CalPERS investment office employees. CalPERS changed its bonus policy under departed Chief Investment Officer Ben Meng so that the performance bonus for the investment staff now depends on CalPERS overall results. Previously, each investment team got a performance bonus based mainly on how they did relative to the benchmark for their strategy, and not overall results.
The CalPERS press release stated that the return benchmark for the fund overall was 4.33%. CalPERS perversely pays investment performance bonuses even if the results are as much as 14 basis points below. That means 4.18% or lower would mean no performance bonuses. Recall our work came up with 4.12%. The reported result of 4.7% would give staff a bonus of 150% of target bonus.
Now there presumably is an explanation for this disparity, so it is bizarre to see CalPERS refuse to provide one. We even helpfully pointed out the two most likely sources.
One is that there could conceivably have been extremely large intra-quarter swings in asset allocation. We would have re-run our analysis using monthly asset allocations, and we would have been able to do that for the previous fiscal year had the results using quarterly averages not come in so close to the official returns.
But when CalPERS reduced its number of investment committee meetings from nine or ten to mere four a year, it also stopped publishing the monthly asset allocation reports. Needless to say, having the board abdicate what already had been limited, and arguably perfunctory oversight of the critically important investment operations, creates baseline concerns about caliber of governance at CalPERS.
Another possible explanation is that CalPERS did not publish its returns for a hodge-podge of investments it previously held which it called “Trust Level”.2 In dollar terms, it consisted almost entirely of its emerging manager program. CalPERS canceled those mandates in late 2019 due to underperformance. CalPERS had peculiarly also lumped its tail-risk hedges in that category.
As Bloomberg reported, Ben Meng gave up a billion-dollar payday for CalPERS when he got rid of the tail risk hedge provided by the Nassim Nicholas Taleb-affiliated fund manager Universa right before the markets imploded in March.
That is a long-winded say of saying that while the “Trust Level” assets could conceivably fill the gap, they would have had to have returned on the order of 70% to do so. Was CalPERS fortunate enough to get out of these investments when the stock market was doing well in 2019, and thus showed strong gains? Perversely, CalPERS could see this result as creating a big optics headache.
CalPERS might be concerned that it would make that bad situation look worse by showing that the other investments they eliminated also outperformed everything else they did, and by a large margin, even if that was due to very lucky timing of the exit.
We asked Mr. Pacheco to supply the missing monthly asset allocation and Trust Level data if they did explain the variance, which puzzlingly, he has not yet done. We have put in a Public Records Act request for this information, so we should receive them in due course.
_____
1 After we ran the numbers, we asked two other people to make independent computations, down to pulling figures from the original records so as to prevent the possibility of replicating data entry errors. Each of us came up with 4.1% or 4.12% in the case of making more granular estimates by working from dollar figures as opposed to CalPERS’ reported asset allocations, which are rounded to the nearest 0.1%.
We would present our spreadsheet, but they don’t display well on WordPress. We will e-mail them upon request. Readers are encouraged to replicate our findings. You can compute 6/30/2020 asset allocations from https://www.calpers.ca.gov/docs/perf-monthly-update.pdf
March 31, 2020: https://www.calpers.ca.gov/docs/board-agendas/202006/invest/item06c-01_a.pdf
Dec 31 2019: https://www.calpers.ca.gov/docs/board-agendas/202003/invest/item08c-01_a.pdf
September 30, 2019: https://www.calpers.ca.gov/docs/board-agendas/201911/invest/item06c-02_a.pdf
June 30, 2019: https://www.calpers.ca.gov/docs/board-agendas/201908/invest/item07c-02_a.pdf
2 Trust Level includes Multi Asset Class, GE Emerging Manager Program, Completion Overlay, Risk Mitigation, Absolute Return Strategies, Plan Level Transition and other Total Fund level portfolios.


